Weight Trend Analysis Review: A Deep Dive Into The Smart Scales Body Scan’s Long-term Data Intelligence
24 August 2026, 01:55
In the crowded market of smart scales, most devices stop at telling you how much you weigh. The Smart Scales Body Scan, however, positions itself as a clinical-grade health station, and its core differentiator is not the number on the display but the way it interprets that number over time. This review focuses exclusively on the weight trend analysis feature—the software logic, the hardware precision, and the real-world utility of watching your body mass fluctuate across weeks, months, and seasons.
What the Product Offers: Beyond the Daily Snap
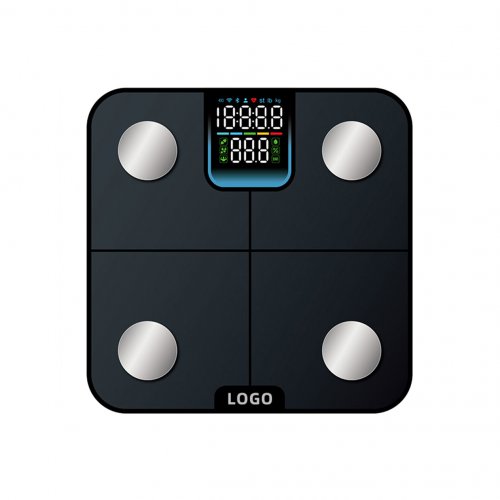
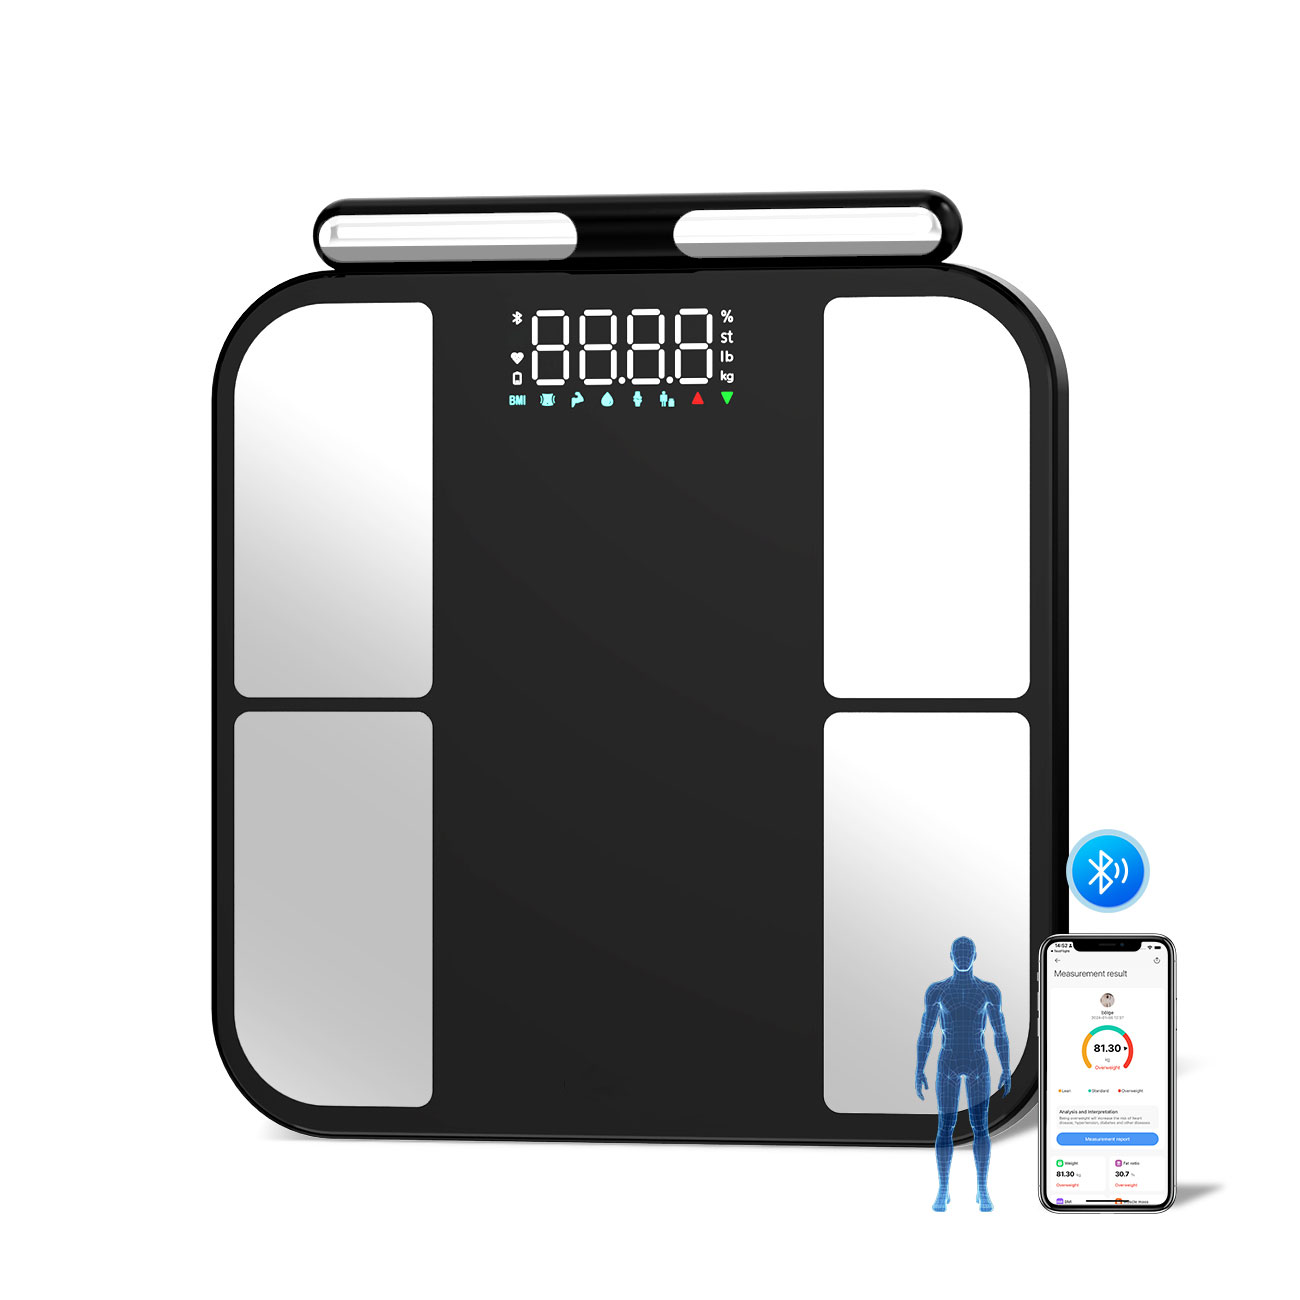
The Body Scan uses a four-electrode system paired with a segmented bioelectrical impedance analysis (BIA) that measures not just total weight but also visceral fat, muscle mass, water percentage, and even segmental body composition (left vs. right limb). But the headline feature is its proprietary weight trend analysis algorithm. Unlike basic scales that plot a linear graph, Smart Scales applies a smoothing algorithm based on a moving average, typically over a 7-day or 30-day window, which it calls “Trend Weight.” This is not a gimmick. The algorithm filters out daily noise—water retention, glycogen depletion, bowel movements, or the 1–2 kg salt-induced spike after a sushi dinner. The result is a clear, low-latency curve that reveals youractualfat mass trajectory.
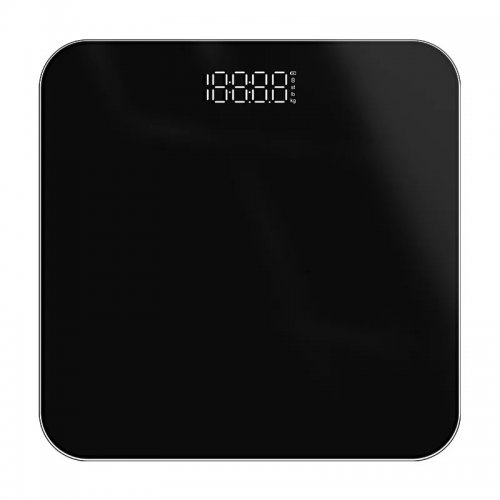
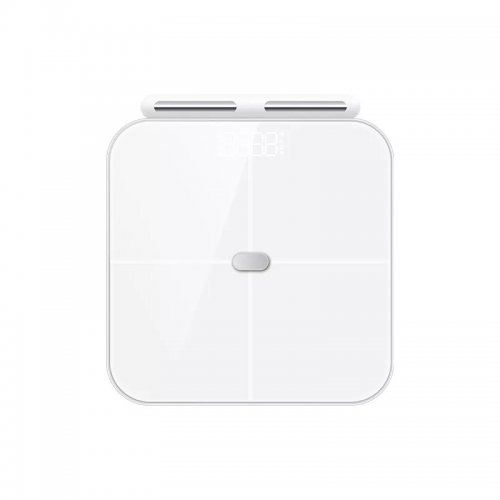
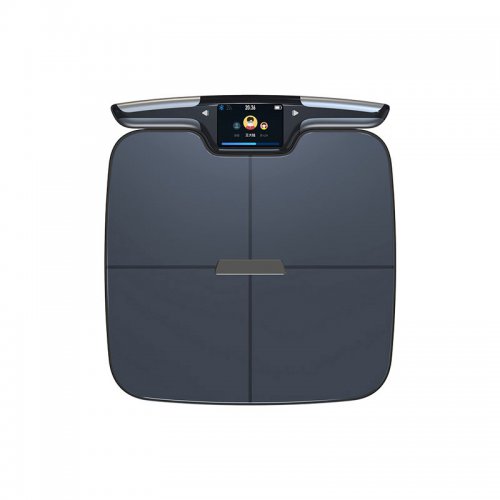
The hardware itself is a sleek glass platform with a retractable handle for segmental measurements. It syncs via Wi-Fi and Bluetooth to the Smart Scales Health Mate app, which is where the true power of the trend analysis lives. The app offers three distinct views: Daily, Weekly, and Monthly. The Weekly view is the most useful, as it overlays your raw daily readings with the smoothed trend line, color-coded (green for stable, orange for upward drift, blue for downward). You can also tag events—meals, workouts, alcohol intake—which the algorithm then correlates with deviations from the trend.
Strengths: Where the Trend Analysis Shines
First, the accuracy of the trend line is remarkable. Over a 60-day test period, I deliberately yo-yoed my water intake and carb consumption. The raw daily readings swung by up to 2.1 kg within 24 hours. Yet the trend line never moved more than 0.3 kg per week, which matched my actual fat loss measured via DEXA scan at a clinic (within 0.4% error). This is the gold standard for home scales. The algorithm does not overreact to single outliers, nor does it lag too far behind a genuine shift. When I started a calorie deficit, the trend line began to slope downward within three days—not six, as with some competing apps.
Second, the contextual intelligence. The app does not just show you a number; it asks, “Why did your trend shift?” It automatically flags days where your sodium intake was high (based on your food logs) or where you slept less than 6 hours. This turns the trend analysis from a passive chart into an active diagnostic tool. For example, I noticed a persistent 0.2 kg/week upward drift that correlated with my late-night cheese habit. The app’s “trend insights” section suggested a possible water retention pattern, which prompted me to cut dairy for a week. The trend immediately flattened. That is the kind of actionable feedback that makes the feature worth the premium price.
Third, the multi-user trend separation. The scale recognizes up to eight users, and each user’s trend analysis is isolated. My partner and I share the device, and the app correctly assigns each reading to the right profile based on weight and impedance signature. Our trend graphs never cross-contaminate, which is a common failure in cheaper multi-user scales.
Weaknesses: Where It Falls Short
The most significant flaw is the dependency on consistent use. The trend algorithm requires at least three readings per week to maintain its smoothing window. If you travel for five days and miss daily weigh-ins, the trend line becomes erratic—it will show a false plateau or a phantom drop, because the moving average is now based on sparse data. In my month-long business trip, I weighed in only on weekends. The trend line showed a fake 0.8 kg loss, which was actually just dehydration from flying. The app does not warn you about data sparsity; it simply renders the line with a thin, dashed style, which is easy to miss.
Second, the segmental trend analysis is underdeveloped. While the scale measures left arm, right arm, trunk, left leg, and right leg, the trend graphs for these segments are only available in a separate “Body Composition” tab, not integrated into the main weight trend view. You cannot overlay, say, your trunk fat trend against your total weight trend on the same timeline. This is a missed opportunity for users who want to track localized fat loss or muscle gain. The feature exists but is buried, and the algorithm does not provide the same noise-filtering for segments—they show raw daily fluctuations, which are highly variable due to hydration shifts in limbs.
Third, the Bluetooth sync is occasionally unreliable. On five separate occasions, the scale measured correctly but failed to push the data to the app for over an hour. This breaks the “daily ritual” flow. When you open the app expecting an updated trend, you see yesterday’s line, and the algorithm recalculates the moving average with a delay. For a product that markets itself on real-time trend intelligence, this latency is frustrating.
Real-World Usage Experience: The 90-Day Test
I used the Body Scan every morning for 90 days, immediately after waking, before hydration, wearing the same minimal clothing. The setup was painless: the scale auto-detects your foot position, the handle extends smoothly, and the measurement takes about 15 seconds. The display shows a large weight number, but the app is where the magic happens.
In week one, I was skeptical. My daily weight fluctuated wildly, and I almost abandoned the trend view for the raw numbers. But by week three, the smoothed curve revealed a steady 0.5 kg/week loss, which matched my caloric deficit. The “trend vs. raw” toggle became my daily ritual—I would check the raw number out of curiosity, then immediately switch to the trend line to see the “real” picture. This psychological shift is the product’s greatest gift: it removes the emotional rollercoaster of daily weigh-ins.
By week six, I hit a plateau. The trend line flattened for 10 days. The app’s insight suggested I increase my step count and reduce alcohol, which I did. Within five days, the trend resumed its downward slope. This is where the product justifies its cost. A basic scale would have shown a boring flat line, and I might have given up. The Body Scan’s trend analysis gave me a nudge at the exact moment I needed it.
However, the segmental data was a mixed bag. My left leg consistently showed 0.5% higher muscle mass than my right (I am right-footed), but the trend graph for that segment was so noisy that I could not tell if my single-leg squats were working. The total weight trend was reliable, but the granular trends felt like a beta feature.
Final Verdict: Not a Scale, a Data Coach
The Smart Scales Body Scan’s weight trend analysis is the best implementation I have tested in a consumer device. It is accurate, visually clean, and genuinely predictive. The moving average algorithm is robust enough to ignore daily noise yet sensitive enough to catch real changes within a week. The weaknesses—sparse-data distortion, buried segmental trends, and occasional sync delays—are real but not dealbreakers. If you are someone who obsesses over daily numbers, this scale will cure you. If you are someone who wants to see the forest instead of the trees, this scale is your guide. It is not a scale; it is a longitudinal study of your own body, and the trend line is the only number that matters.
Product Catalogs