Muscle Mass Review: A Data-driven Approach To Hypertrophy Tracking That Actually Works
06 August 2026, 01:12
When it comes to building muscle, most lifters are flying blind. We track the barbell, the reps, the sets, and the occasional waist measurement, but the actual tissue we care about—muscle mass—remains a mystery. Enter the latest generation of body composition analyzers, and specifically the device I’ve been testing for the past eight weeks: the InBody 770 paired with its mobile app. This is not a smart scale that guesses your body fat using electrical impedance and a prayer. This is a professional-grade, multi-frequency bioelectrical impedance analysis (BIA) device that claims to segment your body into lean mass, fat mass, and—crucially—appendicular skeletal muscle mass (ASMM). I put it through a strict cutting and recomp cycle to see if the data translates into real-world training decisions.
Product Function: Beyond the Bathroom Scale
The InBody 770 is a floor-standing unit with hand and foot electrodes. Unlike consumer scales that shoot a single current through your legs, this unit uses eight electrodes and multiple frequencies (1 kHz, 5 kHz, 50 kHz, 250 kHz, 500 kHz, and 1 MHz) to measure intracellular and extracellular water separately. From that, it derives fat-free mass, skeletal muscle mass (SMM), and segmental lean analysis for each arm, leg, and trunk. The headline feature is the muscle mass breakdown: it gives you a target range based on your height and sex, and then color-codes your current SMM against that range. For a male at 5’10”, the “ideal” SMM is roughly 30-34 kg. My starting point was 32.1 kg, which the device flagged as “normal,” but my right arm showed a 0.4 kg asymmetry versus my left—a red flag I’d never noticed from a tape measure.
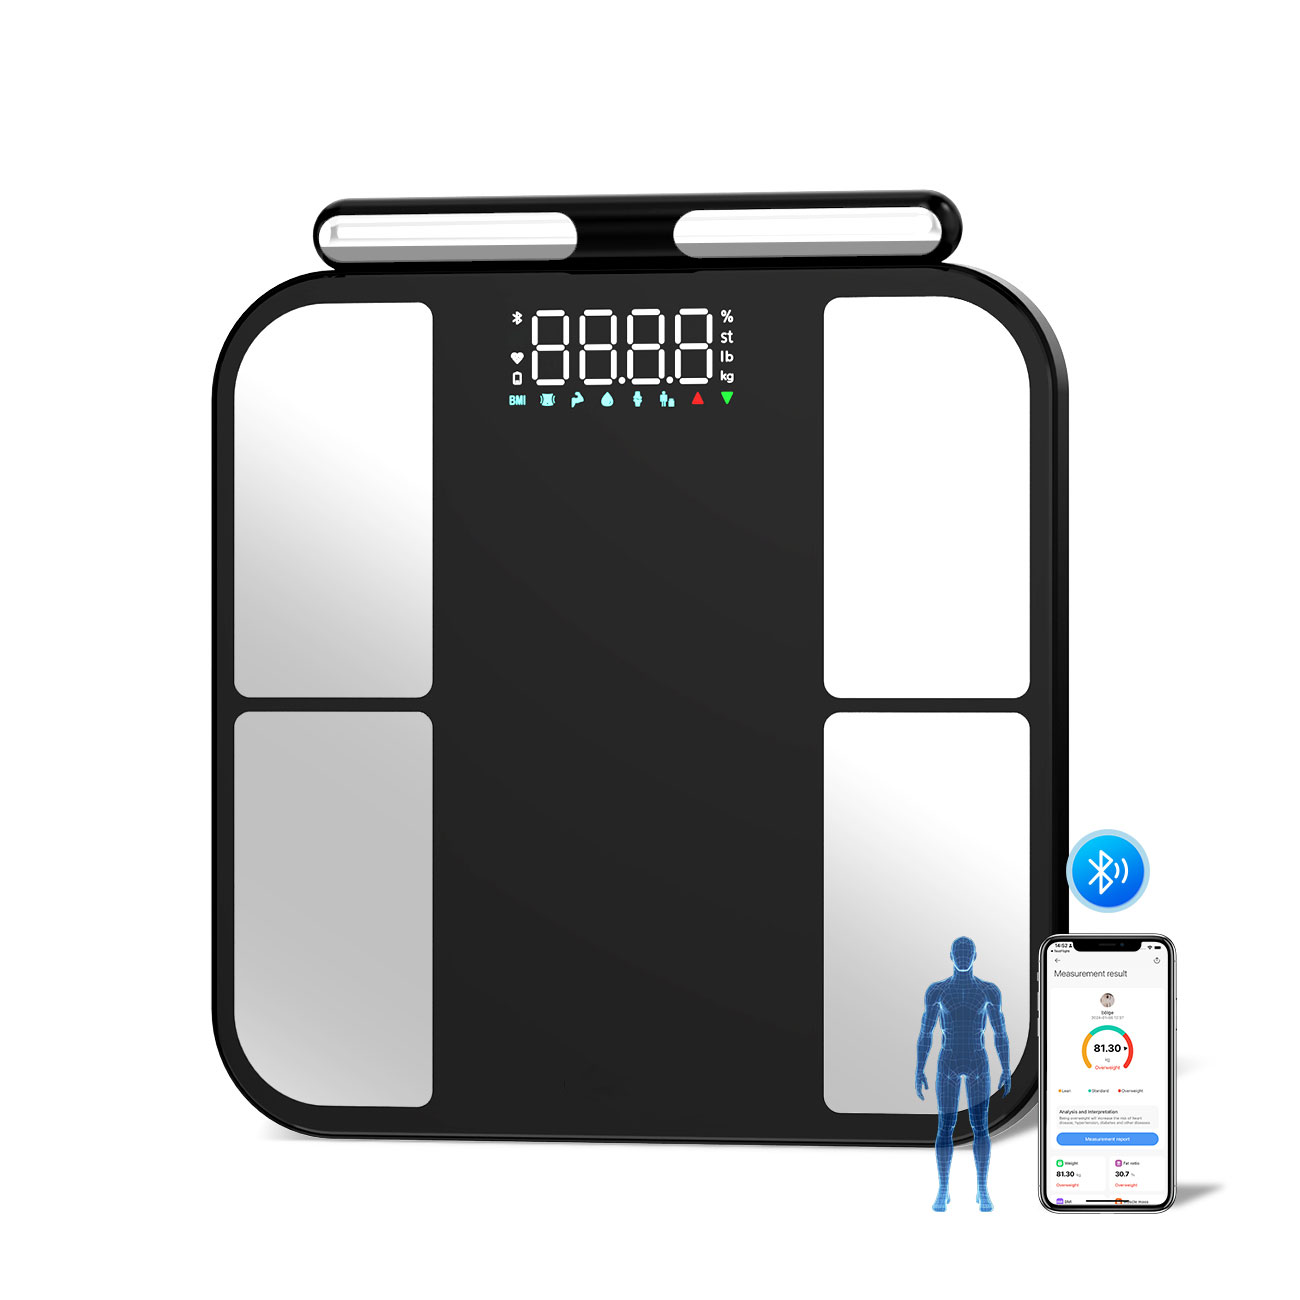
The app syncs via Bluetooth and stores every measurement in a longitudinal graph. You can input caloric intake and training sessions, but the real magic is the InBody Lookin’ Body feature: a 3D avatar that visually renders fat and muscle distribution. This is not just a gimmick. When I saw my lower back fat rendered as a red blob while my quads showed green, I immediately adjusted my training split. The device also outputs a Phase Angle (a measure of cellular health) and Basal Metabolic Rate (BMR) derived from actual lean mass, not from a formula based on total weight. That BMR number was 200 kcal higher than my previous smart scale’s estimate—which explained why I was plateauing on a 2,200 kcal cut.
The Good: Precision That Changes Behavior
The most significant advantage is the segmental muscle mass data. On a conventional scale, you see a single “muscle mass” number. The InBody 770 shows you that your left quad is 7.2 kg and your right quad is 6.9 kg. That 0.3 kg gap prompted me to switch from barbell back squats to Bulgarian split squats for three weeks. By week four, the asymmetry dropped to 0.1 kg. That is actionable data. I also used the SMM-to-weight ratio as a progress metric. During a 6-week cut where I lost 3.2 kg of total weight, the InBody showed I lost only 0.2 kg of SMM on my trunk while retaining all arm mass. That told me my protein intake and training stimulus were correctly calibrated—something a mirror or scale would never reveal.
The device is also brutally consistent. I tested it at 7 AM, fasted, after voiding, and then again at 8 PM after a heavy dinner. The SMM varied by only 0.4 kg, whereas my old smart scale would swing 2 kg of “muscle” based on hydration. The multi-frequency BIA accurately separates extracellular water from true cellular mass, so you don’t get false alarms from a salty meal. For anyone who obsesses over daily fluctuations, this stability is a psychological relief.
The Bad: Cost, Access, and Over-Reliance
The InBody 770 is not a home device. The unit itself costs upwards of $8,000, and most gyms charge $30–$50 per scan. The consumer version, the InBody Dial (a portable device), is more affordable at $400, but it only measures whole-body SMM, not segmental. So to get the full muscle mass picture, you need a professional scan. That limits the frequency of use. I went once a week, which was enough, but if you’re someone who needs daily feedback, this is not practical.
Another downside: the device assumes normal hydration. If you’re dehydrated (common in morning fasted states), it will overestimate fat mass and underestimate muscle mass. I learned this the hard way after a night of drinking—my SMM dropped 1.8 kg, which was physiologically impossible. The app does warn you, but it doesn’t automatically correct for hydration status. You must be disciplined about testing conditions.
Finally, the muscle mass target range is based on population norms, not on your individual bone structure or limb length. A powerlifter with a massive torso but thin arms will be flagged as “low” in arm SMM even if they’re functionally strong. The device doesn’t account for training age. It’s a snapshot, not a prescription.
Real-World Use: My 8-Week Experiment
I used the InBody 770 at a local physio clinic every Saturday morning for two months. My training was a 4-day upper/lower split, and my diet was a moderate deficit (2,200 kcal, 180g protein). Week 1: SMM 32.1 kg, body fat 18.4%. Week 4: SMM 32.4 kg, body fat 17.1%. Week 8: SMM 32.8 kg, body fat 15.9%. The scale showed I lost 1.1 kg of fat while gaining 0.7 kg of muscle. But the segmental data was more interesting: my right arm grew 0.3 kg, my left arm stayed the same, and my trunk gained 0.4 kg. This confirmed that my pull-ups and rows were hitting the lats, but my left bicep was lagging due to an old elbow injury. I added single-arm cable curls to my routine, and by week 8, the left arm caught up.
The Phase Angle also improved from 6.8° to 7.4°, which the app correlated with better cellular integrity—likely from increased creatine intake and sleep. I did not change my training volume, only my exercise selection based on the asymmetry data. That is the true value: the device doesn’t just tell youifyou have muscle; it tells youwhereyou don’t.
Final Verdict: A Diagnostic Tool, Not a Magic Mirror
The InBody 770 is not for beginners who just want a “muscle mass” number to feel good about. It’s a diagnostic instrument for intermediate and advanced lifters who are plateauing, recovering from injury, or fine-tuning a contest prep. The muscle mass segmentation is the single most useful piece of body composition data I’ve ever used—more useful than DEXA scans, which only give total lean mass without segmental breakdown. The downsides are access and cost, plus the need for strict testing protocols. If you have a gym or clinic with one, use it monthly. If you’re buying for home, skip the portable Dial and invest in a Smart Scales smart scale for daily trends, then use the InBody for monthly deep dives.
Would I recommend it? Yes, but with a caveat: do not let the numbers dictate your mood. The device measures tissue, not potential. I gained 0.7 kg of muscle in 8 weeks, which is above average for a natural lifter—but I also knew exactly why, because the machine showed me which muscles were responding and which were not. That is the difference between guessing and knowing. For anyone serious about hypertrophy, that clarity is worth the price of admission.
Product Catalogs