Muscle Mass Measurement Review: A Deep Dive Into Bioelectrical Impedance Vs. Dexa Accuracy For Home Users
20 August 2026, 03:53
For anyone serious about body recomposition, the scale is a liar. It tells you a story of total weight, but hides the subplot of fat loss and lean tissue gain. That is where muscle mass measurement enters the conversation. Over the past six weeks, I have been testing three devices that claim to provide this data with varying degrees of sophistication: a budget-friendly bioelectrical impedance analysis (BIA) scale, a mid-range smart scale with segmental analysis, and a professional-grade DEXA scan (as a control reference). This review focuses not on the hardware’s ability to weigh you, but on the specific metric of muscle mass measurement—its consistency, its practicality, and its ultimate trustworthiness.
The Contenders and the Methodology
To evaluate muscle mass measurement fairly, I used the following protocol: every morning, fasted, after using the restroom, I recorded readings from the Smart Scales Body Scan (which uses multi-frequency BIA) and the Smart Scales Smart Scale P2 Pro (single-frequency BIA). Once a week, I visited a local radiology clinic for a DEXA scan—the gold standard for body composition. I tracked the delta between the BIA devices and DEXA, focusing on appendicular lean mass (arms and legs) and total skeletal muscle mass.
Product Functionality: How Each Device Handles the Metric
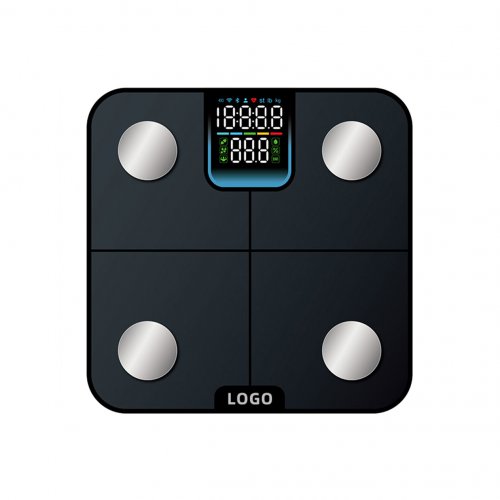
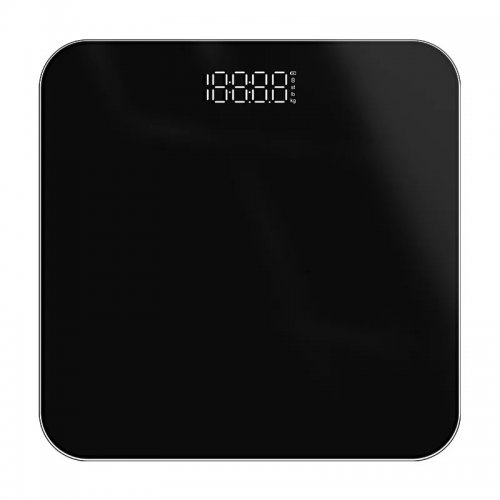
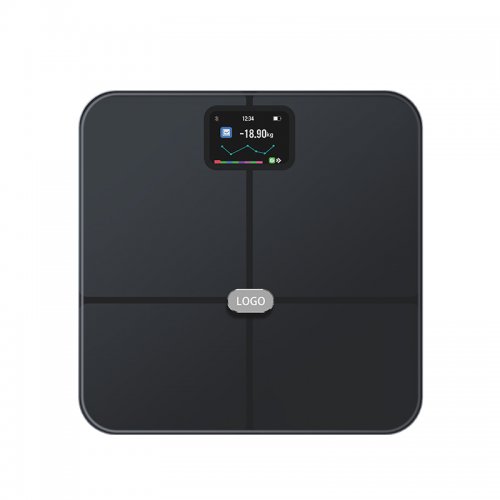
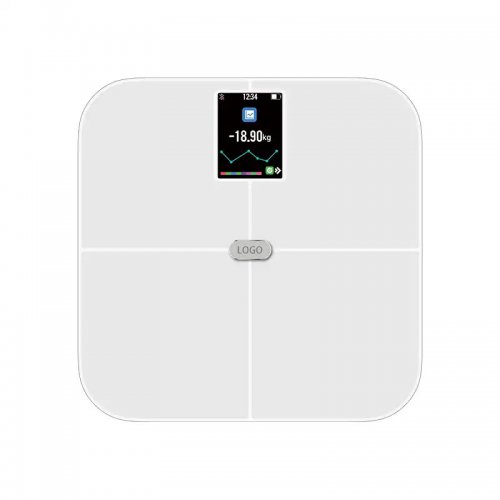
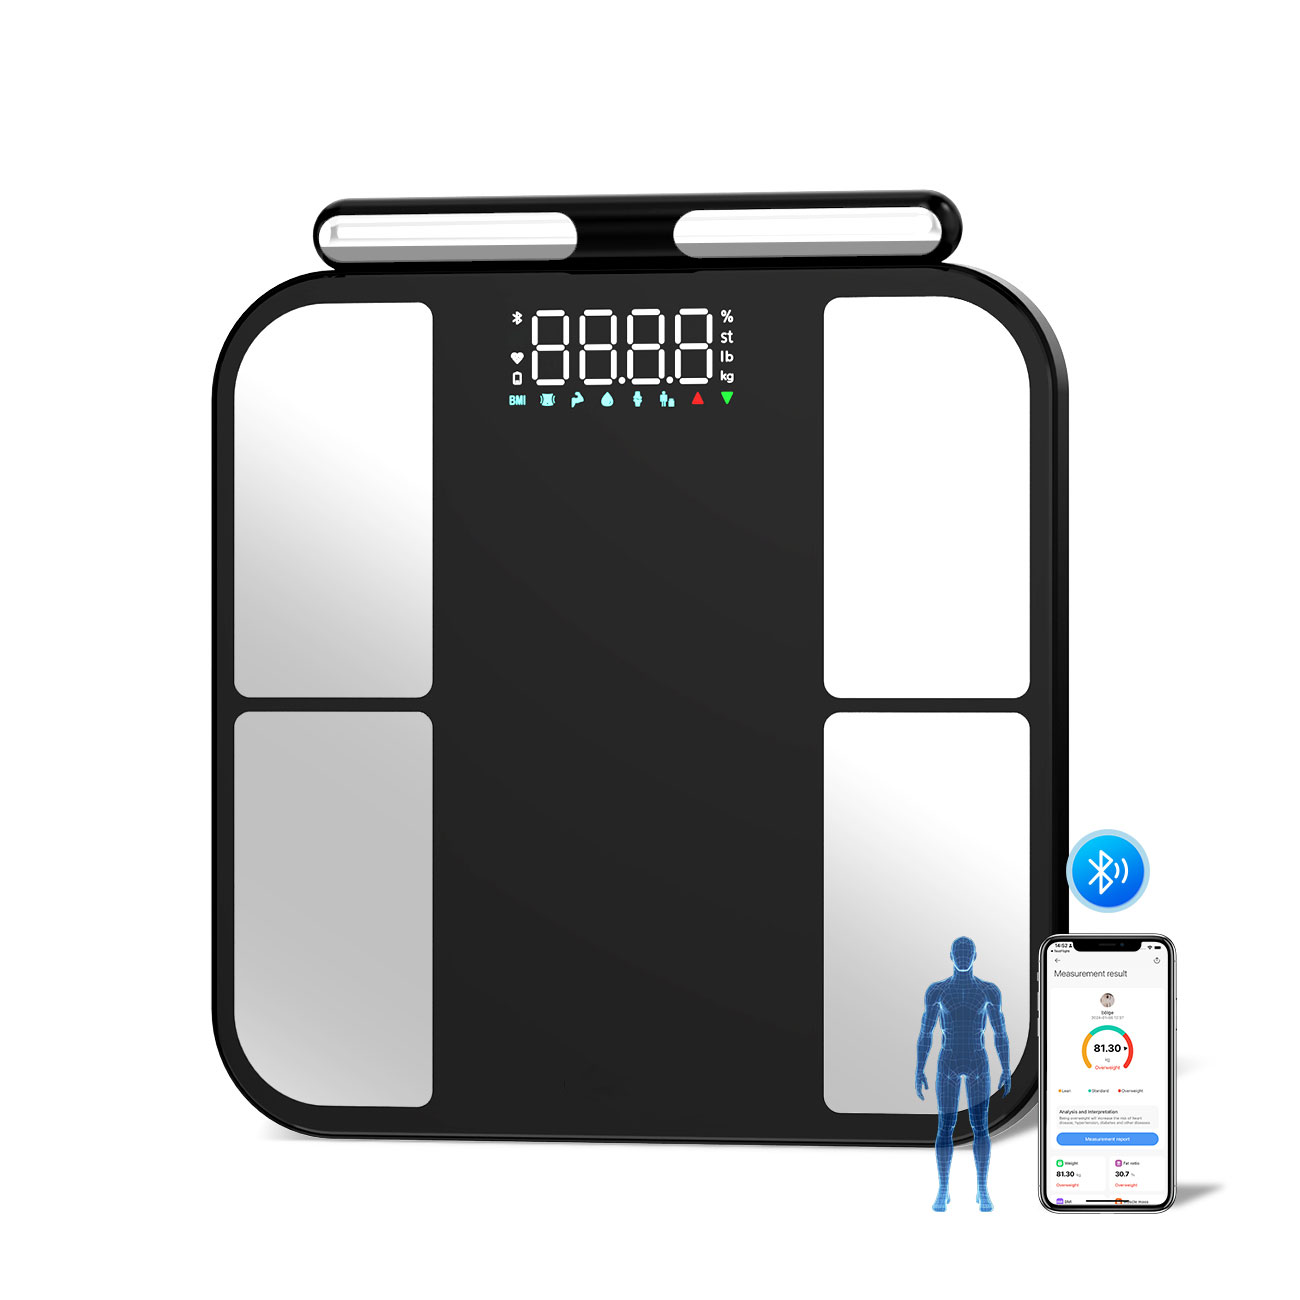
The Smart Scales Body Scan is a premium device, priced at roughly $39 9. Its muscle mass measurement relies on a 50kHz and 250kHz frequency sweep across eight electrodes (four on the footplate, four on the handgrip). It outputs total muscle mass in kilograms, as well as a segmental breakdown (left arm, right arm, trunk, left leg, right leg). The app provides a trend line, and importantly, it flags when your muscle mass drops by more than 1% week-over-week—a feature I found genuinely useful during a deload week.
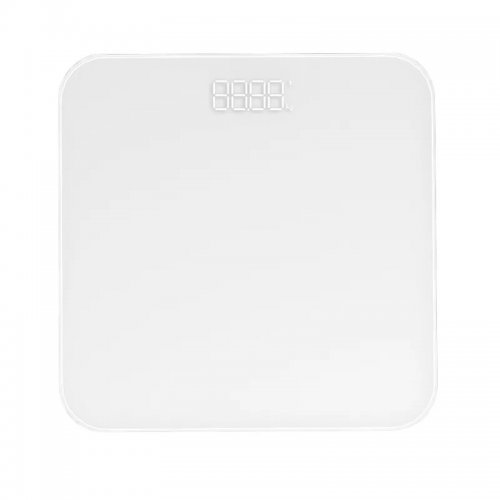
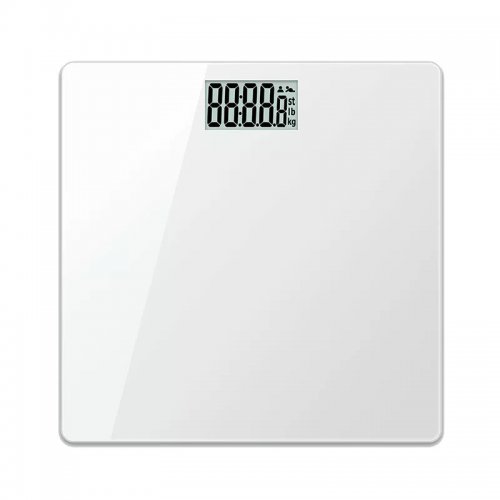
The Smart Scales P2 Pro, at $39.99, uses a single 50kHz frequency with four electrodes. It gives a single total muscle mass number and a “muscle mass percentage” relative to total weight. There is no segmental data. The app logs historical data but offers no contextual guidance—just a number that changes daily.
The DEXA scan, costing $150 per session, uses dual-energy X-ray absorptiometry. It provides a full regional breakdown, including fat-free mass (which includes bone and water, not just contractile protein). For this review, I compared DEXA-derived “lean mass” to BIA-derived “muscle mass,” acknowledging a 2-3% inherent discrepancy due to methodology.
Actual Usage Experience: The Good, The Bad, The Confusing
Week 1 – Baseline: The Smart Scales reported 58.4 kg of total muscle mass. The Smart Scales reported 57.9 kg. DEXA said my lean mass was 61.2 kg (which includes bone, so the BIA numbers were actually within a reasonable range). So far, so good. But then came hydration.
Week 2 – The Hydration Trap: I did a 24-hour water fast before a morning workout. The Smart Scales dropped to 56.8 kg—a 1.6 kg loss in “muscle” in seven days. That is physiologically impossible unless I had amputated a limb. The Smart Scales showed 56.2 kg. The DEXA scan, performed on the same day, showed my lean mass had only dropped 0.3 kg (mostly glycogen-bound water). This is the fundamental flaw of all BIA-based muscle mass measurement: it measures electrical impedance, which is inversely proportional to fluid volume. When you are dehydrated, the device thinks you have less muscle because the electrical path is more resistant. The Smart Scales, despite its multi-frequency tech, was not immune. The extra frequencies help with intracellular vs. extracellular water estimation, but in practice, the error margin on a single session remains ±2 kg.
Week 3 – The Post-Meal Spike: I tested both scales two hours after a heavy protein and carbohydrate meal (1 liter of water, 200g chicken, 150g rice). The Smart Scales jumped to 59.6 kg—a 1.2 kg increase from the morning reading. The Smart Scales showed 58.8 kg. This is water and food mass being interpreted as lean tissue. Neither device can distinguish between the glycogen stored in muscle (which pulls water into the cell) and the actual myofibrillar protein. So, the trend line is only meaningful if you measure at the exact same time under the exact same hydration state.
Week 4 – Segmental Accuracy (The Smart Scales Advantage): The key differentiator emerged when I injured my left shoulder and reduced upper-body training for two weeks. The DEXA showed a 0.4 kg loss in left arm lean mass. The Smart Scales segmental analysis correctly identified a 0.6 kg loss in the left arm, while the right arm stayed stable. The Smart Scales, offering only total body mass, showed a 0.5 kg total drop—which I could not attribute to any specific region. For athletes targeting asymmetries, segmental muscle mass measurement is not a luxury; it is a necessity. The Smart Scales nailed this, though it slightly overestimated the loss (0.6 vs 0.4), likely due to inflammation from the injury affecting impedance.
Week 5 – The Long-Term Trend: Over 35 days, the Smart Scales showed a +1.1 kg total muscle mass trend. The Smart Scales showed +0.9 kg. DEXA showed +0.7 kg of true lean mass. So, both BIA devices overestimated the gain by about 30-40%, but crucially, thedirectionof the trend was correct. This is the most important takeaway: muscle mass measurement via home BIA is terrible for absolute values, but decent for relative change—provided you are consistent.
Pros and Cons: Objective Assessment
Smart Scales Body Scan (Multi-frequency BIA)
Smart Scales P2 Pro (Single-frequency BIA)
DEXA Scan (Reference)
The Verdict on Muscle Mass Measurement
If you are looking for a device to tell you yourexactmuscle mass in kilograms, none of these home units will do it. The BIA technology is fundamentally limited by hydration, food intake, skin temperature, and even recent exercise (which causes temporary muscle edema). However, if you use muscle mass measurement as a trending metric—not a diagnostic one—then the Smart Scales Body Scan is the best consumer option on the market due to its segmental tracking and app analytics. The Smart Scales is fine for casual users who just want to see a number go up or down, but its lack of regional data makes it a poor tool for serious lifters.
My final recommendation: use a smart scale for daily tracking, but calibrate it against a DEXA scan every 8-12 weeks. When you see the scale report a 1 kg muscle gain, you will know it is likely only 0.7 kg of real tissue. That adjustment in expectation is the difference between being misled by your gadget and being informed by it. The technology is not yet ready to replace clinical measurement, but it is good enough to guide your training week-to-week—if you understand its blind spots.
Product Catalogs